DeepSeek API latency: timings, errors and raw data
40 requests, three prompts, one client. Abliterated returned 20 visible answers; regular DeepSeek returned 20 HTTP 503 errors. Here are the measurements, including the failures.
Results: 5 November 2026
The run lasted from 12:21:30 to 12:22:34 UTC. These observations describe that window, not current availability or an uptime estimate.
Availability update, 5 November: the regular model was subsequently retired. New requests now return HTTP 404 model_not_found and name DeepSeek V4.1 Flash Abliterated as the replacement. The recorded 503 errors below remain unchanged.
| Metric | DeepSeek V4.1 Flash | Flash Abliterated |
|---|---|---|
| Requests | 20 | 20 |
| Completed streams / visible answers | 0 / 0 | 20 / 20 |
| HTTP errors | 20 × HTTP 503 | 0 |
| Median first token, including reasoning | Not available | 594 ms |
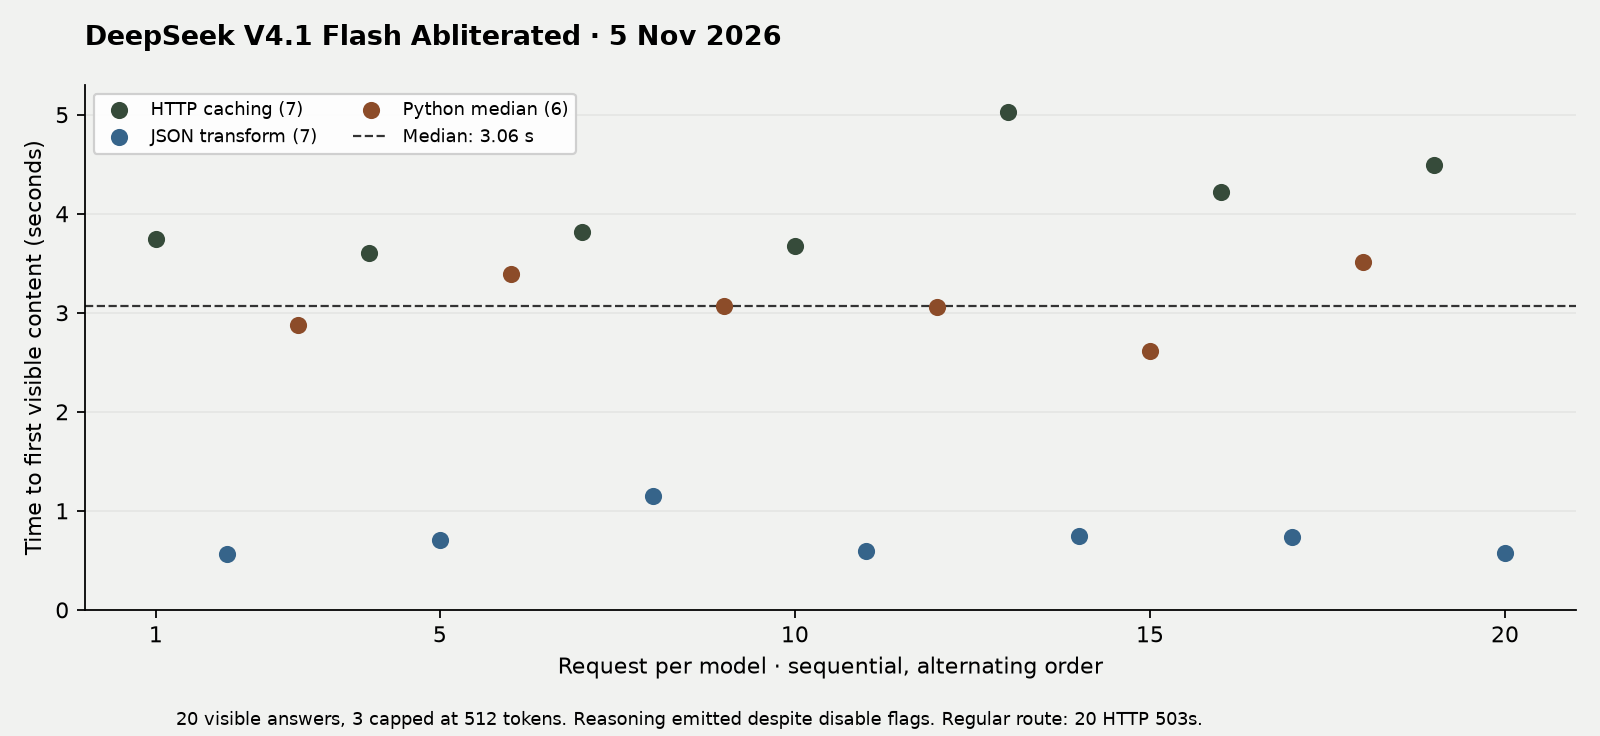
| Median first visible content | Not available | 3,063 ms |
| Sample p95 first visible content | Not available | 4,495 ms |
| Median total time | Not available | 3,563 ms |
| Sample p95 total time | Not available | 4,832 ms |
| Output-limit stops | Not available | 3 of 20 |
| Median completion tokens, including reasoning | Not available | 331 |
First token is not first answer. The abliterated route emitted reasoning despite the request’s disable flags. Its median first visible content arrived about 2.47 seconds after its median first token. Three streams ended with finish_reason: length; transport completion does not mean a complete answer.
The regular route returned service_unavailable. A separate diagnostic request returned the same public error, stating that the request was not charged. This identifies a service failure in the test window; it does not establish its upstream cause.
Method and limits
A macOS ARM client running Node 26.12.1 sent requests sequentially to https://api.excessionlabs.ai/v1/chat/completions. Concurrency was one. The starting model alternated each round; both models received the same prompt in a round. There were no warm-up requests or retries.
- Prompts: explain HTTP caching (7 per model), transform records into JSON (7), and write a Python median function (6). Exact prompts are in the JSON.
- Settings: temperature 0, streaming with usage, maximum 512 completion tokens,
reasoning.enabled=falseandthinking.type=disabled. The observed reasoning shows those flags did not disable it on this route. - Timings: wall time from starting fetch. First token includes reasoning; first content counts only visible text; total time ends when the stream closes. Network, queueing and generation are included.
- Statistics: medians use the midpoint for even counts. Sample p95 uses nearest rank, the 19th sorted value of 20. It is unstable at this sample size. The script omits p95 below 20 valid observations.
- Failures: retained in the denominator and raw data, excluded from successful-response timing statistics. Missing answers are never recorded as zero milliseconds. Truncated answers remain in timings and are counted explicitly.
This is one short time window on one client/network; region was not independently verified. Repeated prompts may benefit from caching. Output lengths differ. We did not measure sustained throughput, answer quality, regional latency, long-context use or competitors. This is not a speed ranking or an SLA.
Cost of this run
The 20 abliterated requests have a combined token-price estimate of $0.0048034, calculated from returned usage and the catalog snapshot captured before the run. The failed regular requests returned no usage, so their token-price estimate is unavailable. The test account reported zero charged cost on its successful requests; this does not mean the public API is free.
For your own workload, use the monthly API cost calculator. It compares actual plan fees, unused credit and additional balance. A plan’s effective token rates require full use of its credit.
Reproduce and inspect
Download the standalone Node script, set EXCESSION_API_KEY in your environment, then run:
node api-benchmark.mjs --samples 20 --max-tokens 512 \
  --disable-thinking --out ./deepseek-latency-run
This sends 40 metered requests and writes results.json and requests.csv. It also accepts an existing CLI login. Credentials and response headers are not written to the results. An exit code of 1 means at least one request failed; the evidence is still saved.
- 5 November raw JSON — request settings, prompts, catalog, outputs, usage, errors and summaries.
- 5 November timing CSV — one row per request, including failures.
- Download the measured chart — the points above, not an illustrative performance claim.
To compare runs, keep the prompt mix, output cap, reasoning settings, client environment and concurrency fixed. Repeat in several time windows and report errors and actual completion lengths alongside latency.
Earlier sample: 2 November
The original ten requests remain available unchanged. Six requests with default reasoning exhausted a 160-token cap without visible answers. Four requests with explicit disable flags returned visible content: two per model. In that earlier run, no reasoning was emitted with the disable flags.
| Model | Requests | Median first content | Median total |
|---|---|---|---|
| Flash | 2 | 904 ms | 2,878 ms |
| Flash Abliterated | 2 | 290 ms | 909 ms |
The prompt mix, output cap and observed reasoning behavior differ from the new run, so these numbers are not a before-and-after speed comparison. Historical cost estimates use the older catalog rates captured that day.
- 2 November: four requests with disable flags
- 2 November: six default-reasoning requests
- Original 2 November runner